Monitoring infrastructure
This document aims to provide required information to understand the monitoring capabilities available in an Azure hardened subscription. Required vocabulary is available in the Glossary.
Introduction
By default every cloud service we provision in Azure can produce logs. Azure Hardened subscription include built-tin monitoring capabilities based on Azure Log analytics workspace. Azure Log Analytics workspace is a sub-component of the Azure Monitor offer.
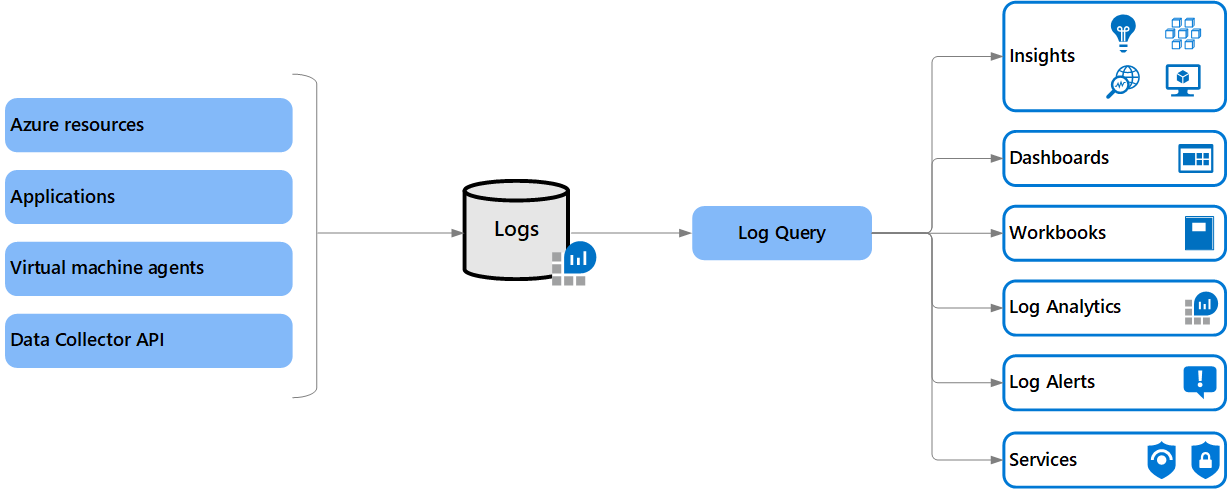
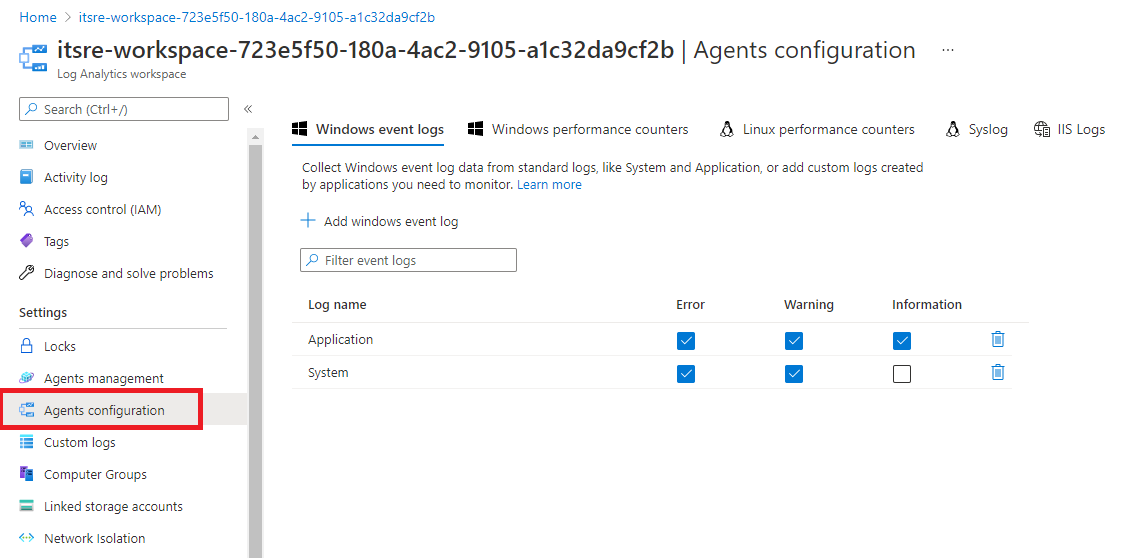
Every Azure Hardened subscription have a dedicated Log Analytics workspace created in the tdp-he-monitoring-rg. This Log Analytics workspace is dedicated to the TDF BL consumer to store logs and metrics. Service configuration is under responsibility of the TDF BL consumer. A default configuration of the Azure Log Analytics workspace has been set for Windows and Linux Virtual machines as illustrated bellow:
Automatic monitoring onboarding
Azure Hardened subscriptions are configured with a set of azure policies to enforce the following Azure services to send their logs to your dedicated Azure log Analytics workspace in your Azure hardened subscription. This configuration is automatic for the following Azure resources:
- Subscription Azure Activity logs
- Virtual machines
- Virtual machines Scale-sets
- Azure Bastion
- Application Gateway
- Azure Firewall
- Azure Key Vault
- Azure Function
- App services
- Azure Load Balancer
- Azure MariaDB databases
- Azure MySQL databases
- Azure PostGRESQL databases
- Network Security Groups (NSG)
- Public IP
- Storage Accounts
All these Azure services will be sending their logs to:
- Your dedicated instance of Azure Log Analytics workspace
- The TDF SOC Team central Log Analytics workspace (only for security related logs)
Bellow we have the configuration of the Azure public bastion service provisioned by default in your Azure Hardened subscription.

Virtual machine monitoring
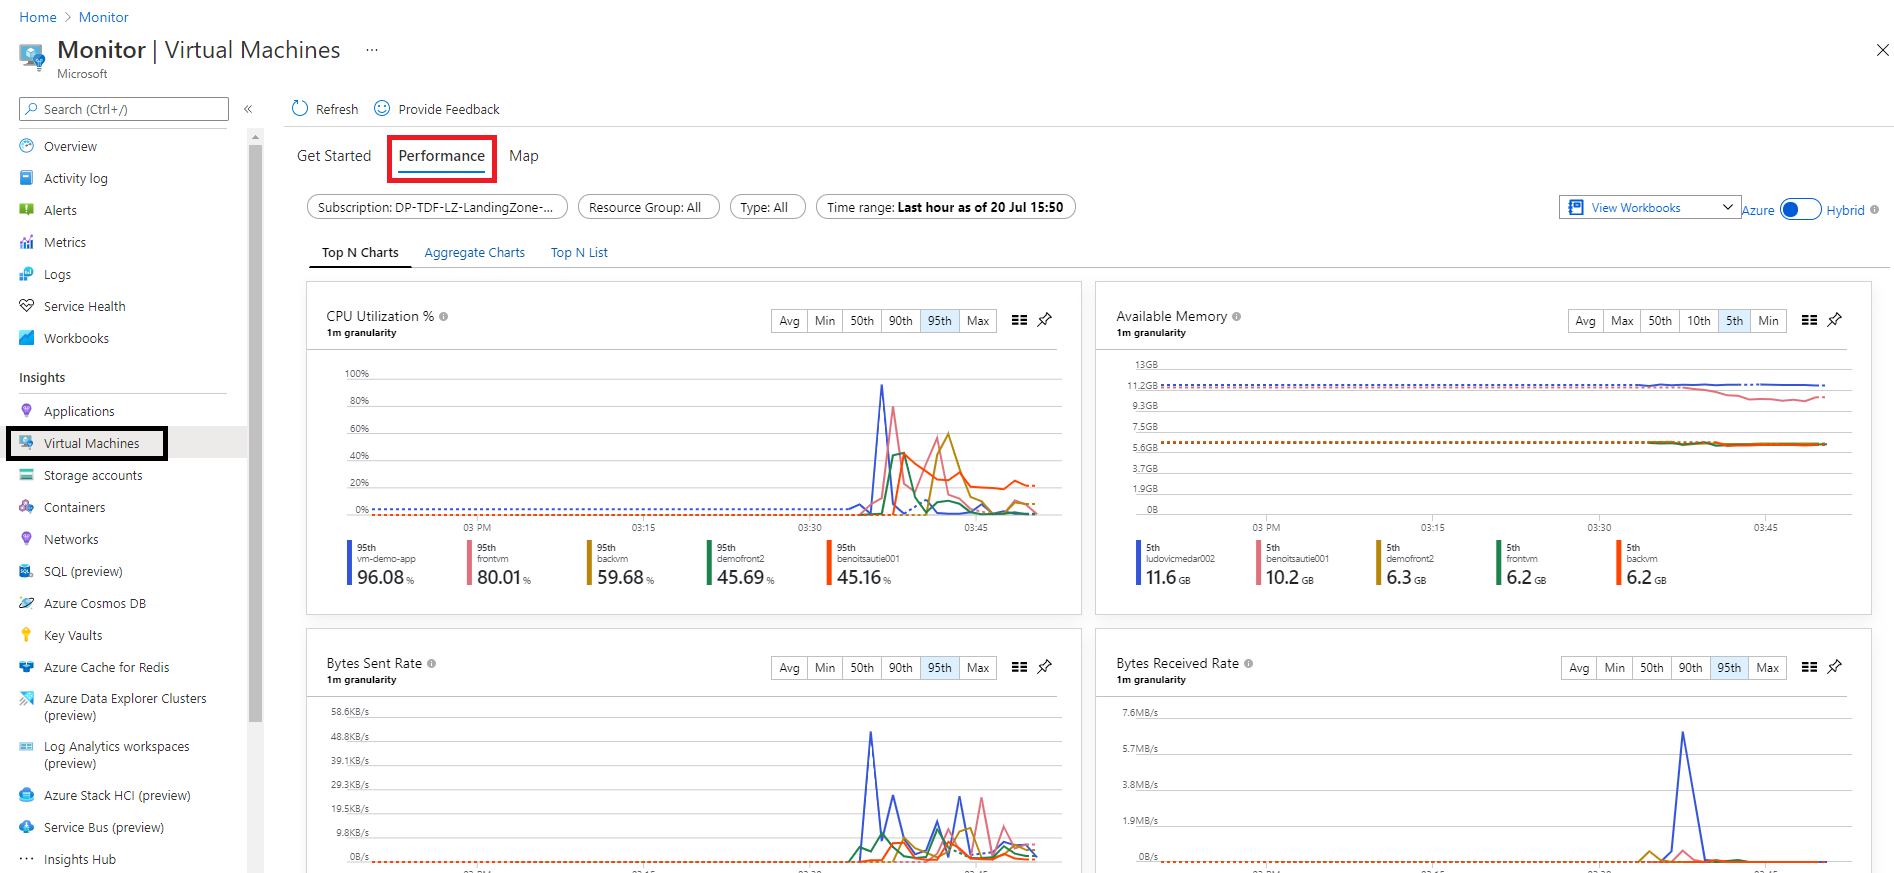
Due to product constraints, it was not possible to configure the dual monitoring for virtual machines. At time of writing, the Microsoft Monitoring Agent (MMA) support dual instances on Windows operating system but only single instances on Linux-based operating systems. For this reason, all logs related to Virtual machines are sent to your dedicated Log Analytics workspace instance. By default, every virtual machine created in your Azure Hardened subscription will be connected to your dedicated Log Analytics workspace instance to send logs and metrics. You can track performance counters from Azure and even from your virtual machines operating system from Azure Monitor as illustrated bellow:
Your virtual machines are automatically configured for the Azure Service Map solution. Using collected logs from your virtual machines, Azure Service map solution is capable establish dependencies between your virtual machines and even other Azure services. In illustration bellow we have all dependencies related to virtual machines within a single Azure hardened subscription.
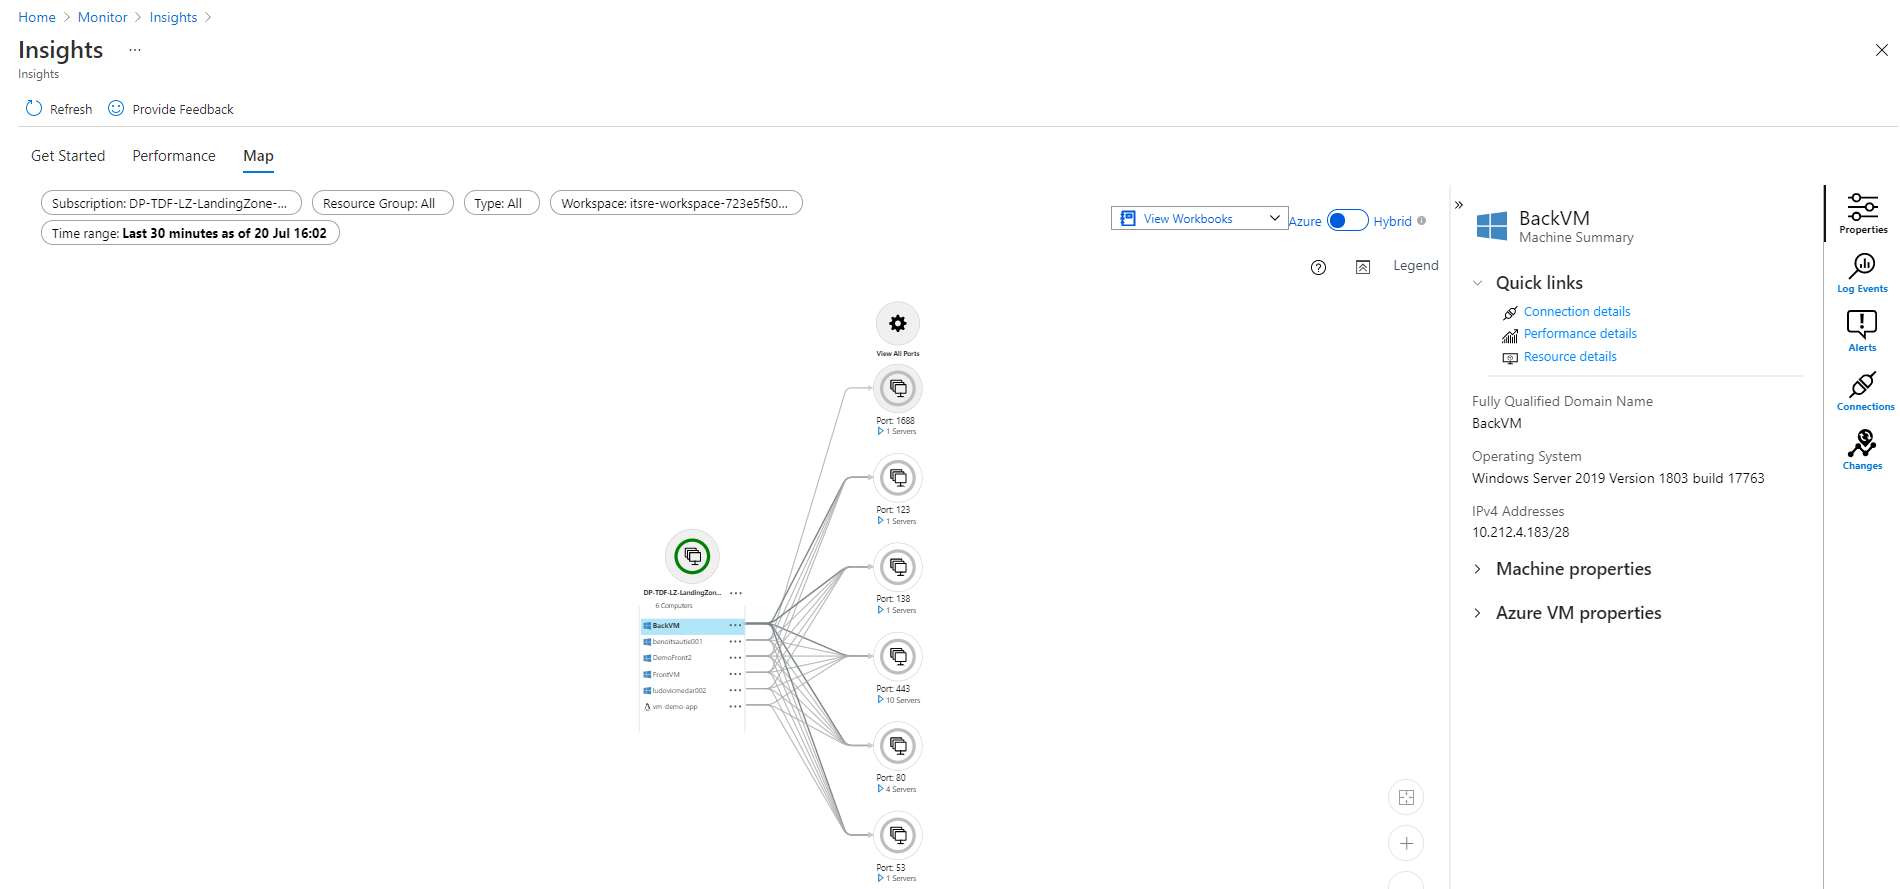
This solution include: Track processes in the virtual machine Track successful /failed network connection from the windows Firewall / IP Table logs
Manage cost of Azure Monitor
Log Analytics cost depend on two major criteria’s:
- The amount of logs ingested by Azure Log Analytics workspace
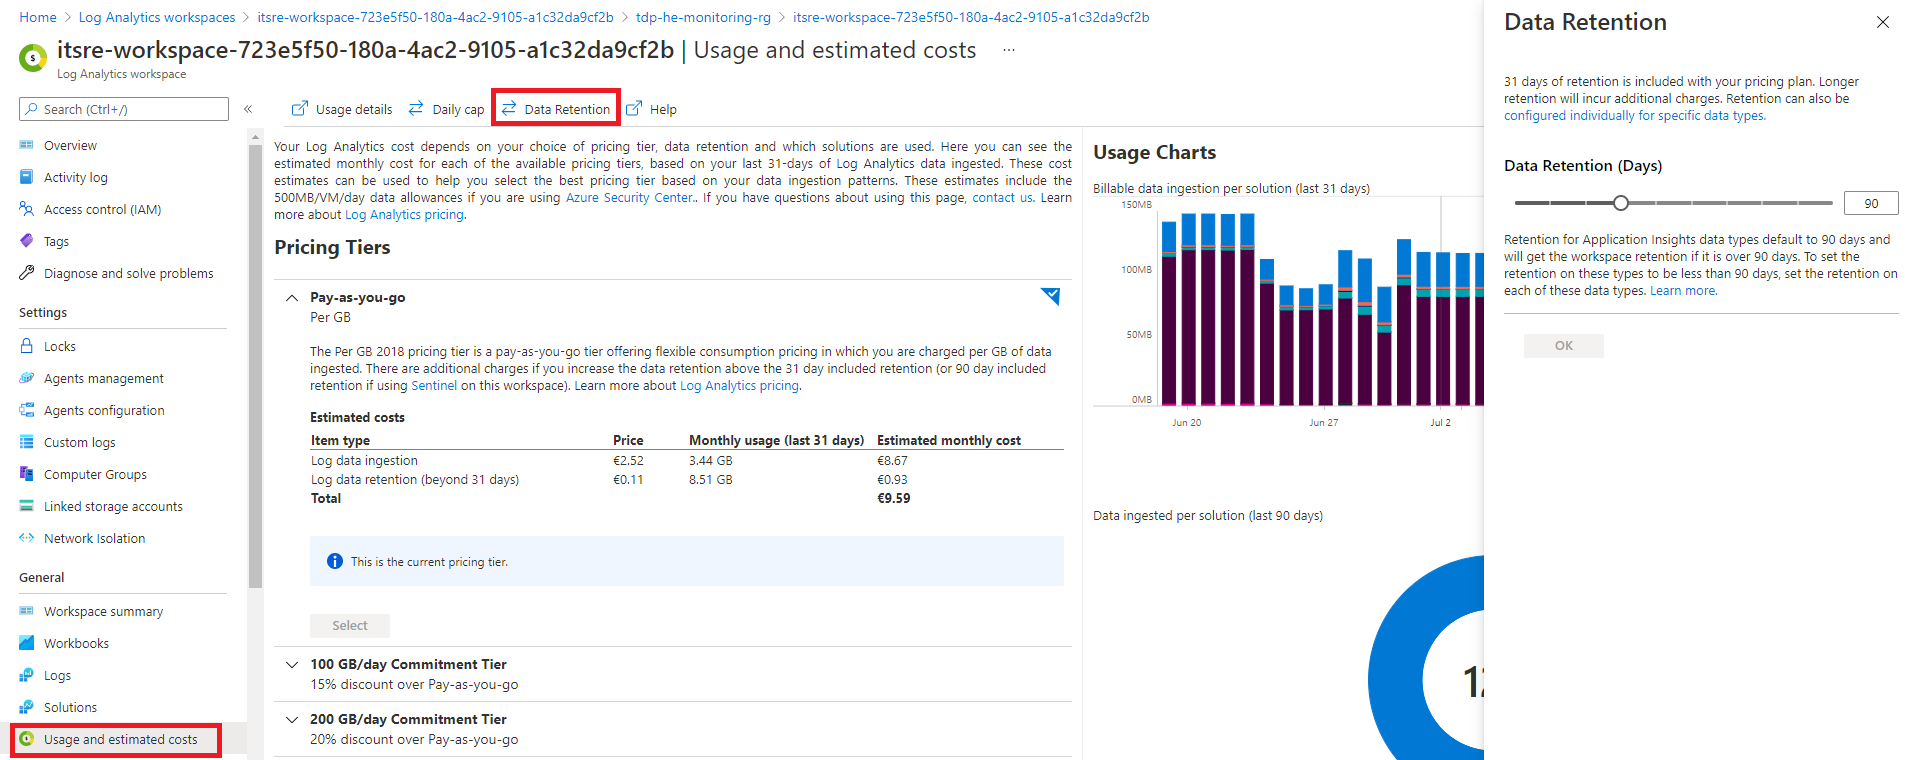
- The retention period we apply to our logs
We can track down these costs directly in your dedicated Azure Log Analytics workspace as illustrated bellow:
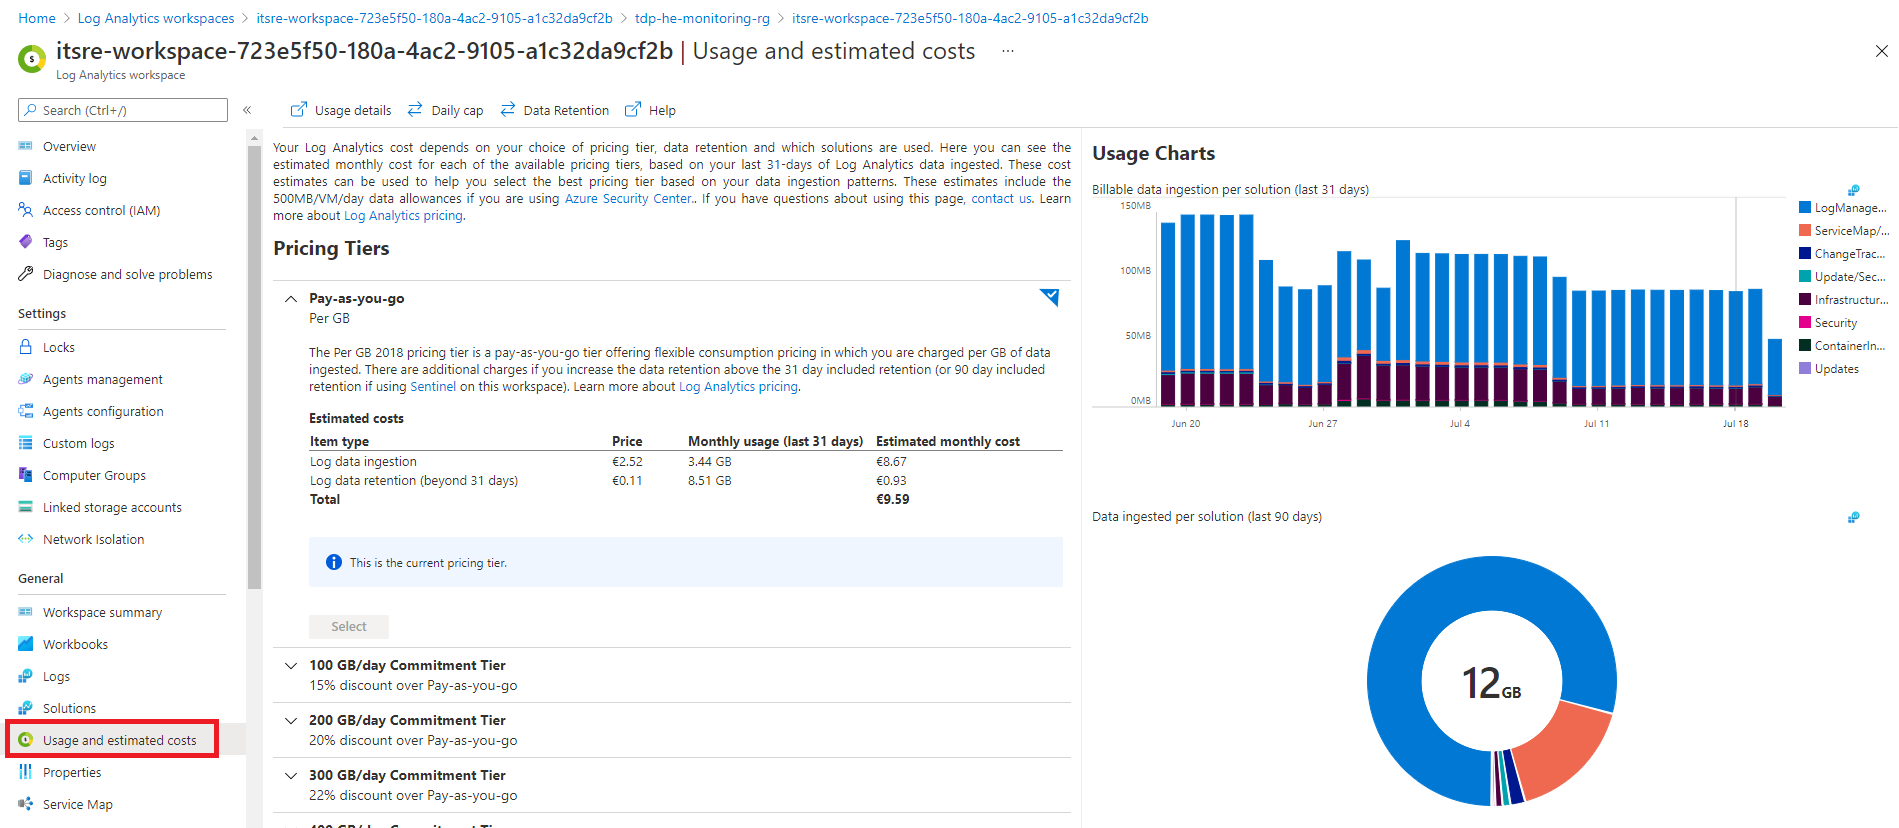
We can also track down theses costs using the following KUSTO queries. You can manage Azure log analytics costs by adapting the retention period to your need as illustrated bellow. Remember that the first 31 days of ingestion are free. The longer you store logs, the more you will pay.
If required for non-production environment, you can enforce a daily collection limit using the daily cap feature available here:
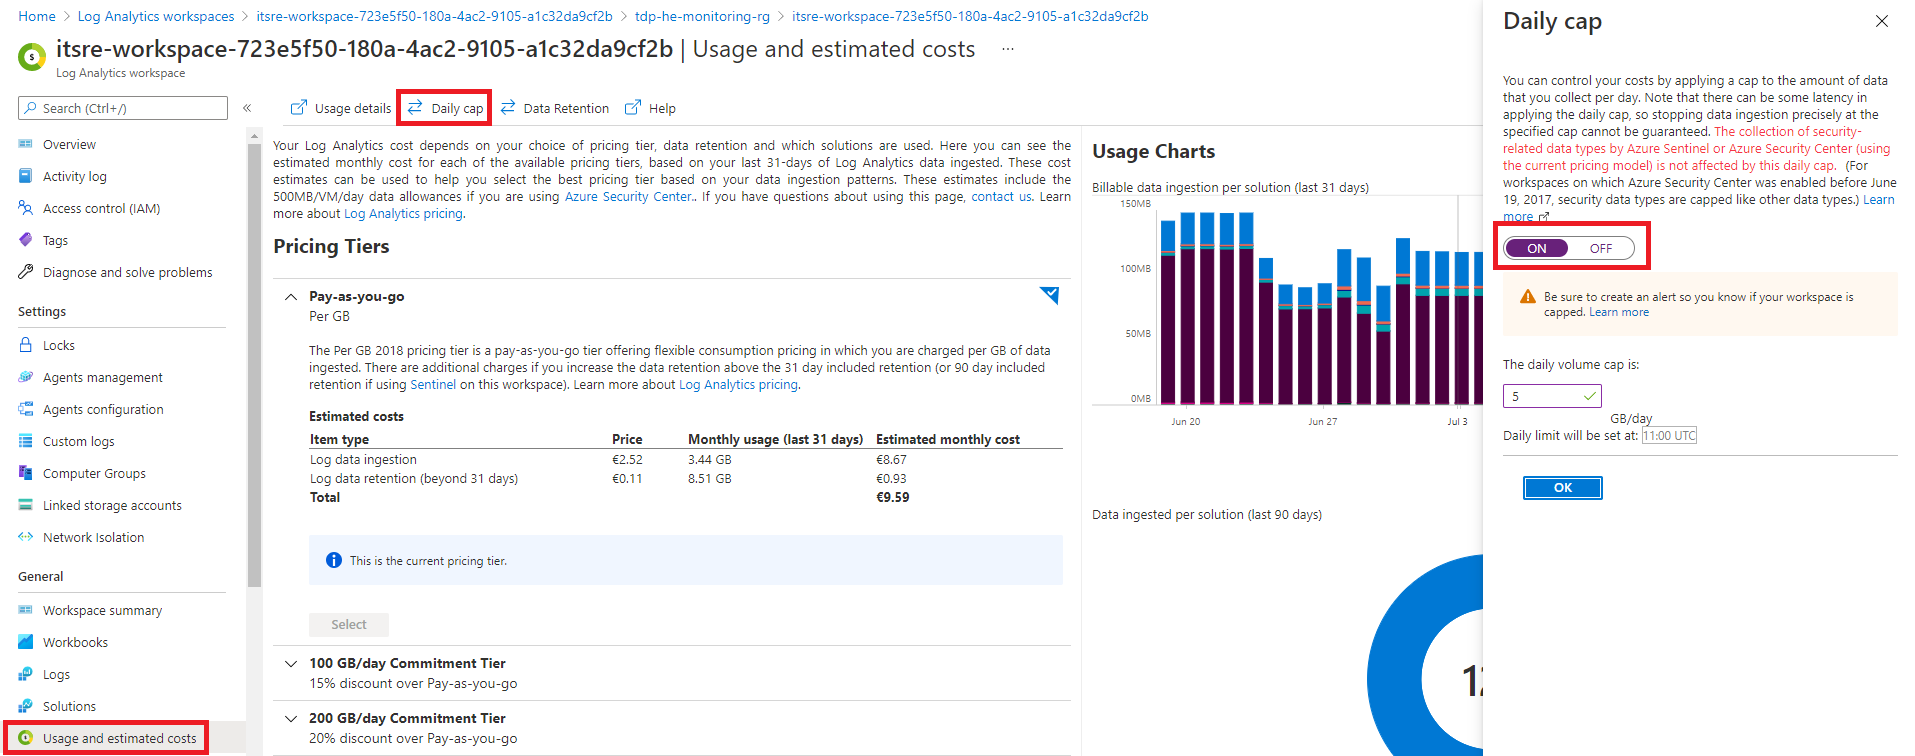
This data ingestion is applicable at Azure resource level. Security related logs are excepted from this daily limit collection.
Access default Dashboard
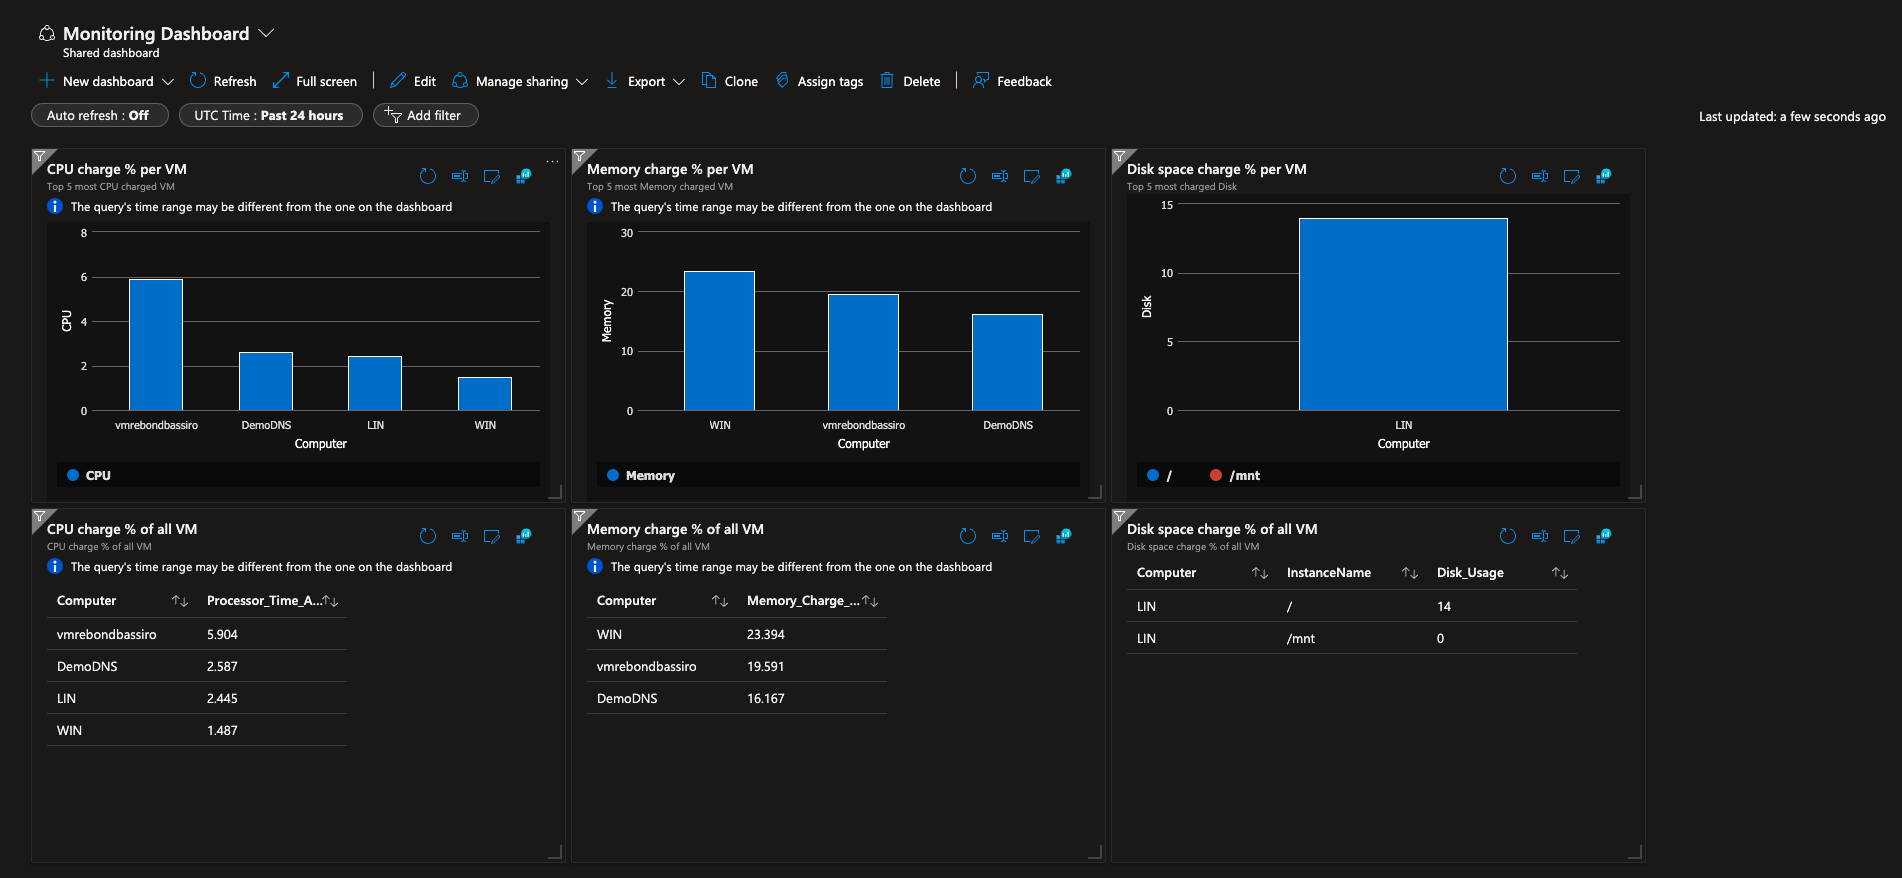
A dashboard named "DefaultMonitoringDashboard" is available under tdp-he-monitoring-rg resource group. The dashboard display some interesting KPI about your resources and can be customized if needed. Here is the Microsoft documentation for help to edit it.
Monitoring alerts�
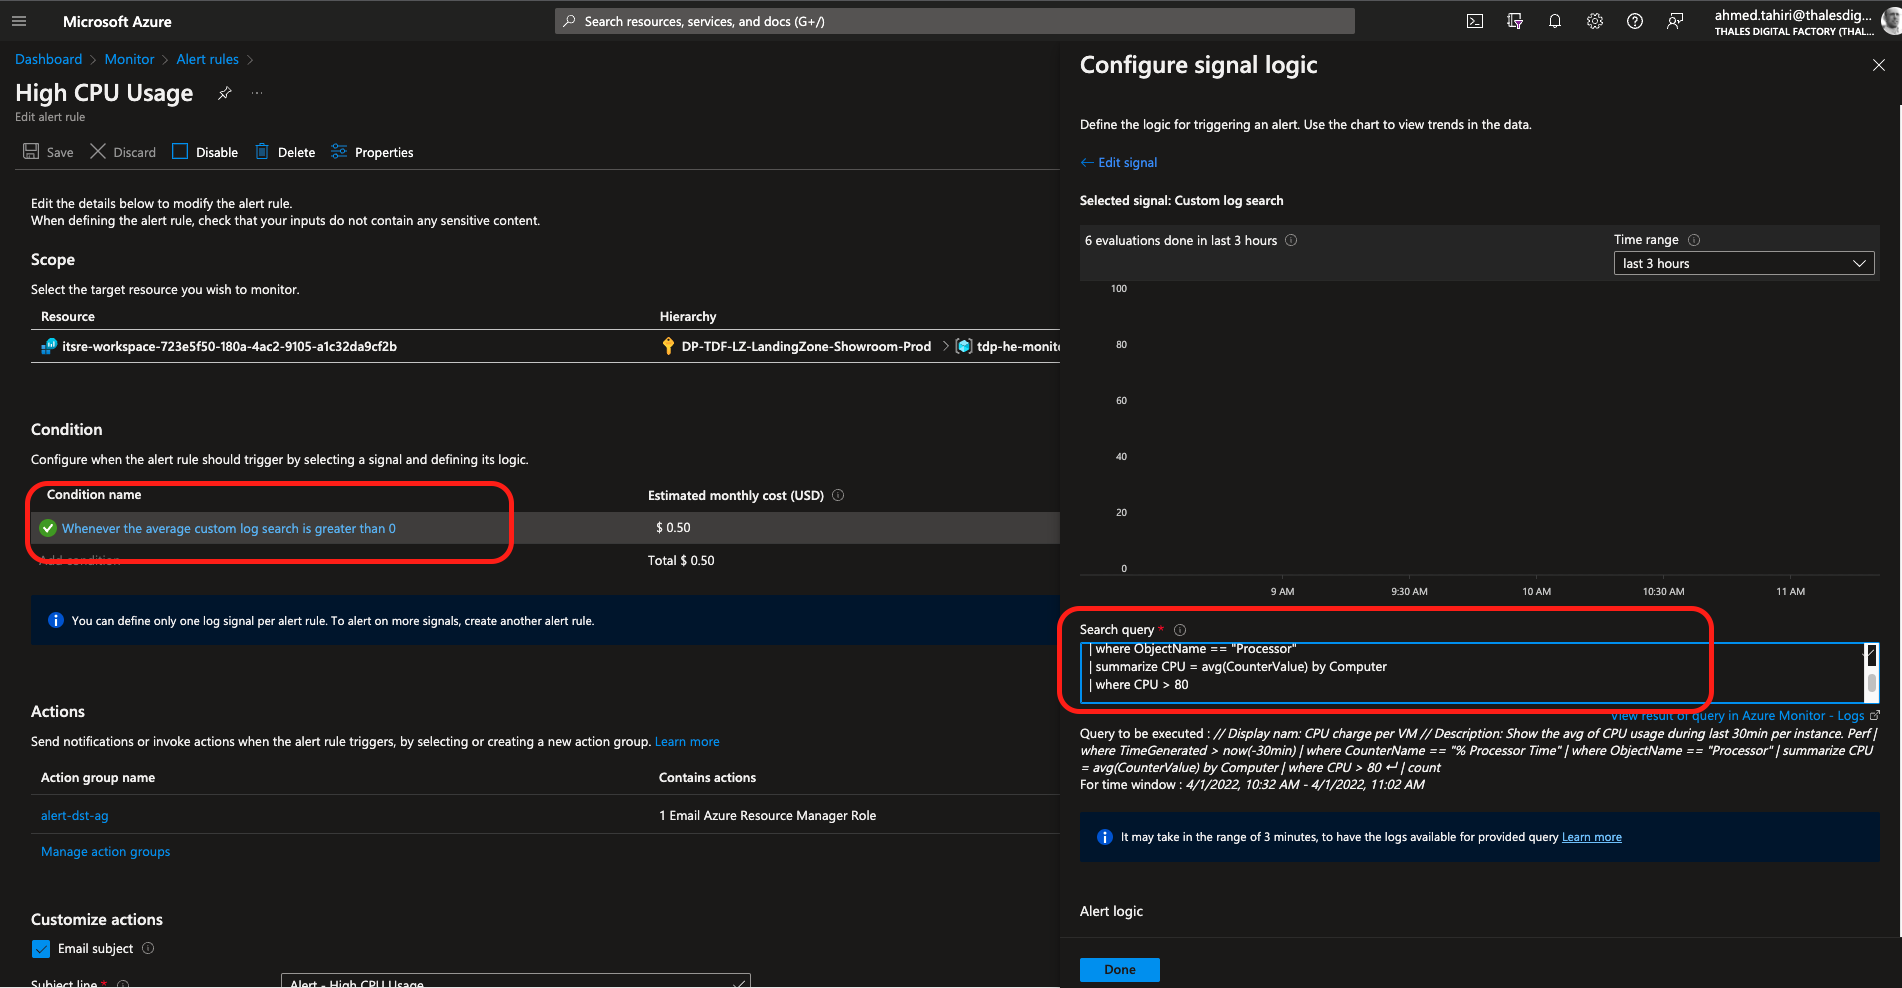
Some alerts like beneath are predefined to warn about anomalies. Only accounts that have "Azure Monitor reader" get alerted by emails.

To access the alerts definition, go to Azure Monitor and select Alerts as follow:
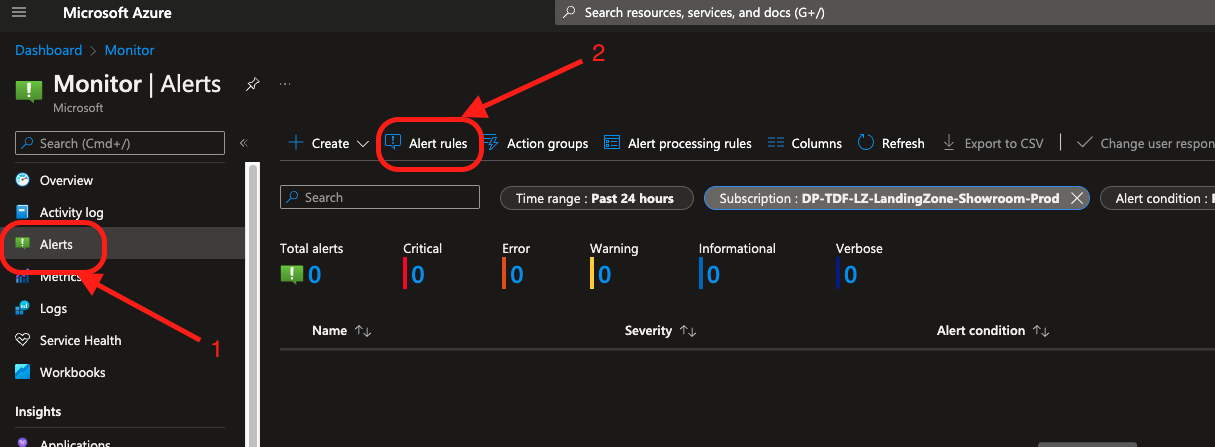
The rules of the alerts can be tunned by modifying the KQL queries
Generally, you can find documentation about Azure Monitor alerts here